Rental Profit Calc User Guide
- Discounted Cash Flow Analysis
- Defaults
- Determining the Discount Rate
- Thoughts on Input Field Estimation
Discounted Cash Flow Analysis
Discounted Cash Flow (DCF) analysis is a method used to estimate the value of an income-producing property (or any asset) by projecting its future cash flows and discounting them to present value using a discount rate.
Key Steps in a Real Estate DCF Analysis (with Example)
- Project Future Cash Flows
- Estimate the Terminal Value (Value when Sold)
- Discount All Cash Flows to Present Value
1. Project Future Cash Flows
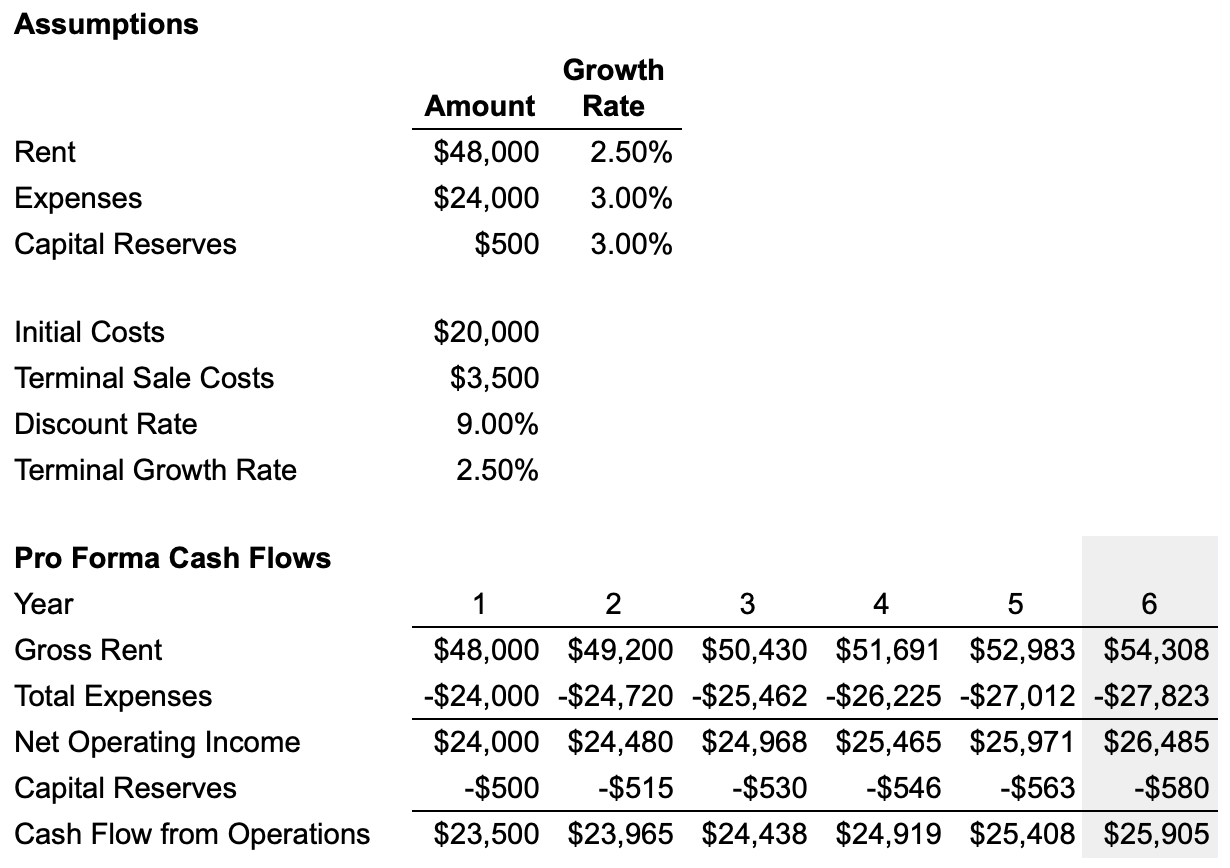
In this step we take our assumptions and create a Pro Forma Cash Flows projection for 5 years. You see a sixth year there but that is for the purposes of calculating the terminal value in the next step. The goal here is to derive the Cash Flow from Operations. Notice we don't have a mortgage payment, taxes, etc. Discounted cash flow analysis for real estate assumes a 100% equity stake in the property and before tax cash flows. The reason is that we want to estimate the income generating potential of the asset independent of financing decisions or the owner’s tax position. Also, debt structure and taxes can change over time which incorporates an additional risk factor into the equation. It is possible to conduct a DCF analysis and account for both debt and taxes but from our experience these models are more complicated and tend to overestimate the value of the property and downplay risk.
2. Estimate the Terminal Value
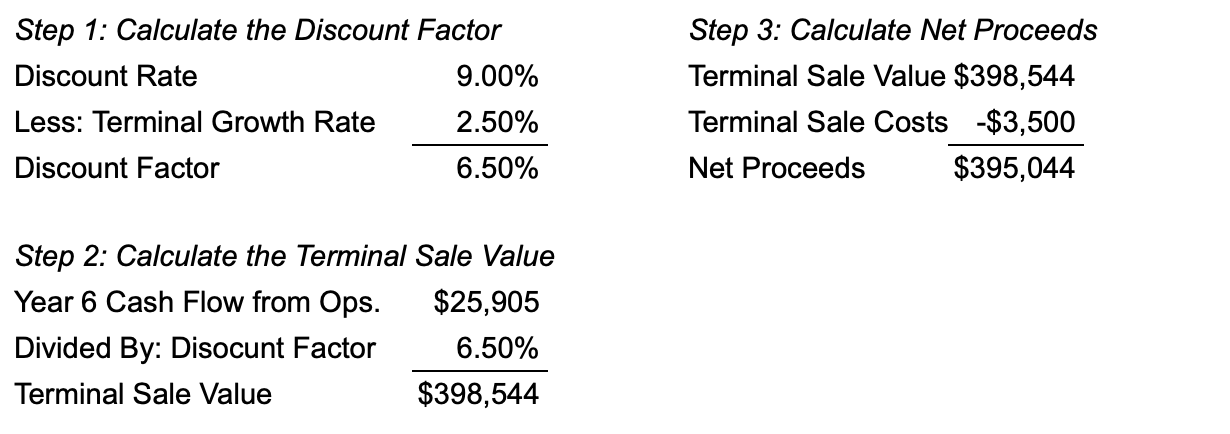
Basically, we want to calculate the value of the property at the end of year 5, the year in which we sell it. In order to do that we need year 6's Cash Flow from Operations and discount that into perpetuity. For that you will also need the discount rate and the terminal growth rate. The terminal growth rate should be a value that realistically estimates the property's long term cash flow growth. Here we have 9% for the discount rate and 2.5% for the long term cash flow growth rate. In Step 1 we net those values to arrive at 6.5% then in Step 2 we divide that into the year 6 cash flow. The formula is as follows: $25,905 / (9% - 2.5%) = $398,544 [p = cf / (r - g)]. The name for this simple discount model is called the Gordon Growth Model and is useful for long term asset estimations with stabilized cash flows. In Step 3 we subtract out the cost of selling the property like commissions and closing costs to arrive at the Net Proceeds at the time of sale of $395,044.
3. Discount the Cash Flows to the Present
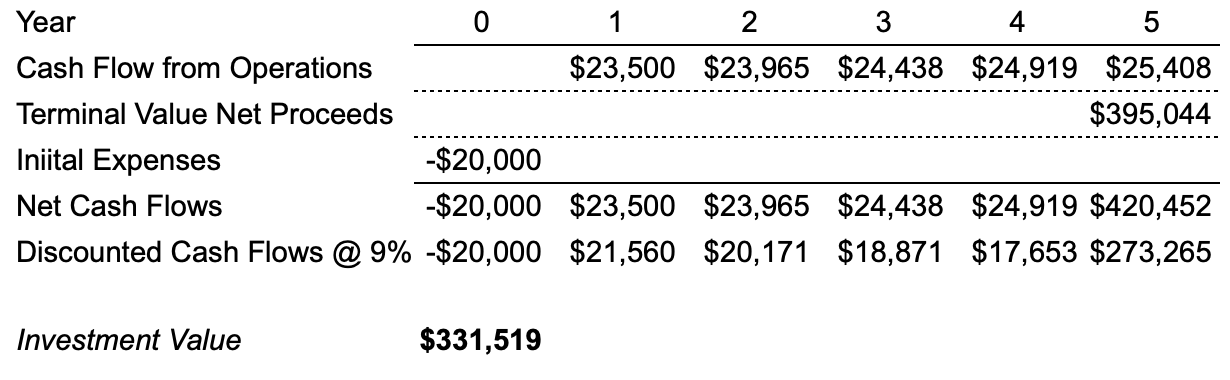
The final step is to add all the cash flows together and then discount them to arrive at the investment value or estimated price of the property with a discount rate of 9%. Here we took the Cash Flow from Operations, Terminal Value Net Proceeds, and in year 0 (today) the initial costs (closing, fix up costs, etc.) then discounted them back to the present value. For example year 3's cash flow is $24,438, we discount that back with the following equation $24,438 / (1+0.09)^3 to give us $18,871. Summing all of those values gives us the investment value of $331,519, which can be used to compare the current listing price of the property to see if it is undervalued, overvalued, or just right.
The Importance of Discounted Cash Flow Analysis
Working through a DCF analysis places your investment decision on firm footing. You can readily see the relationships between cash flow, prices, and risk over time. With DCF you will work through your expense estimates, determine your rent based on market analysis, account for capital expenditures to keep the property functioning, and express the risk of cash flows in terms of a discount rate. You can then determine an appropriate price you will be willing to pay for the cash flows the property is expected to generate. This process guards against paying too much for a property especially when the logical thought process is derailed believing that someone will pay a higher price in the future based on hope and not cash flow.
Defaults
We've set default values for some of the input fields in order to get you started quickly. These defaults are well reasoned but not necessarily correct for your analysis. Here's the reasoning behind the defaults we've set.
Vacancy Rate 7.30%
Average vacancy rate from 1956 to 2024
Source: https://fred.stlouisfed.org/series/RRVRUSQ156N
Expense Inflation Rate 3.3%
This is the average inflation rate from 1913 to 2024
Source:
https://www.minneapolisfed.org/about-us/monetary-policy/inflation-calculator/consumer-price-index-1913-
Income Growth Rate 2.3%
This is based on two parts: (1) the expense inflation rate and (2) “Geltner, et al, Commercial Real Estate: Analysis and Investments, On Course Learning, 2014 pp. 232-233” which reasons that the growth rate of long term held properties drops below inflation because of property aging. Rents may grow at or faster than inflation overall but those are usually carried by the newest multifamily properties being built. Basically, we took our inflation rate and docked it 100 basis points. Your mileage may vary.
Percent Down 25%
This is the standard many banks require as a down payment (LTV 75%)
Source:
https://www.multifamilyrefinance.com/apartment-investing-blog/commercial-loan-down-payments
Mortgage Rate 7%
Current mortgage rate as of 2/5/2025 (and rounded a bit). This will change more than the other defaults and can vary a lot by your own circumstances, type of loan, loan term, etc.
Cost at Sale 7.12%
This is a combination of commission and closing costs at the time of sale of the property (terminal value). This is from 2 sources:
Avg. Commission Rate 5.32% https://listwithclever.com/average-real-estate-commission-rate/
Avg. Closing Costs Rate: 1.5% https://www.fool.com/money/research/average-closing-costs/
5.32% + 1.5% = 7.12%
Terminal Growth Rate 2.3%
This is the rate of growth of the before tax cash flow of the property expected into perpetuity at the time of sale. We use the income growth rate for this. For a long term projection of growth into perpetuity [which is what we are doing by calculating the terminal, sale, value of the property (Before Tax Cash Flow / (Discount Rate - Terminal Growth Rate)] we think this is both a conservative and reasonable value.
Discount Rate 9%
This is derived from the formula “Risk Free Rate + Risk Premium = Discount Rate”. The “Risk Free Rate” is the current 10 year Treasury Bond as of 2/5/2025 of 4.54% and a long term risk premium for high grade commercial real estate of 4.55% from “Geltner, et al, Commercial Real Estate: Analysis and Investments, On Course Learning, 2014 p. 245”. 4.54% + 4.55% = 9.09% For more on discount rates see our discussion here.
Determining the Discount Rate
The discount rate is an essential part of discounted cash flow analysis since it is used to discount future cash flows back to the present to determine the investment value of a property.
The discount rate in real estate (and in finance generally) represents the opportunity cost of capital—the return an investor requires to justify investing in a given property instead of alternative investments. It incorporates:
- The Risk-Free Rate: baseline return with no risk
- A Risk Premium: to compensate for real estate-specific risks
- Comparison to Other Investments: to ensure competitive returns
There are a few ways to derive the discount rate. One popular model is as follows:
Determining the Risk Free Rate
The risk free rate used for real estate analysis is usually the US Treasury 10 Year Bond since it matches real estate cycles better than say the 3 Month US Treasury Bill. It is viewed as a default risk free investment and sets the baseline of the discount rate calculation. Another way to look at it is if the US Treasury 10 Year Bond rate is 4.5% and an estimated return on a more risky investment, say a multi-family property you're looking at, was the same, why would you take on more risk in purchasing the property when the Treasury Bond is guaranteed? A rational investor would not. So beyond the risk free rate you would demand a risk premium. That risk premium should take into consideration the risk of the future cash flows of the property you are analyzing. Real estate is going to be riskier than a Treasury Bond so that is your starting point.
Determining the Risk Premium
Rental Profit Calc is focused on investing in multifamily properties that you will hold for at least an extended period of time. Some determinants of a risk premium are factors like:
- Asset Class & Risk: Class A (prime) properties have lower discount rates due to lower risk. Class C/D properties have much higher discount rates.
- Market Location: Properties in top-tier cities (NYC, SF, London) have lower discount rates than secondary/tertiary markets.
- Liquidity & Tenant Stability: Properties with long-term, credit-worthy tenants have lower discount rates.
These factors and possibly others will help you determine what risk premium you should use. Let's say historically a Class A property in a prime location (NYC) with high tenant stability has a risk premium of 4.5%. Then you know that if you are investing in a Class C property in a rust belt city your risk premium should be higher. That doesn't mean the property in question is a bad investment, it's just that the risk of cash flows varying is more likely than the safer class A property.
Putting It All Together
The discount rate you use, just like any input you use in your property analysis needs to be as accurate and reasonable as possible. If you use a high discount rate of say 30% then you may miss opportunities in some profitable investments because the bar you set is unrealistically too high. If you use too low a discount rate then you may be taking on too much risk for the given return. Think of determining your discount rate as the rate the average intelligent investor would use in their analysis. Ask yourself, "for a given property taking into account all of its known particular characteristics, market, and economic environment, what would be a fair discount rate?" Also remember that this rate is the return on a 100% equity investment for the purposes of a discounted cash flow analysis. Since the cash flows used are "before tax operating income" which does not include a mortgage payment, we are valuing the cash flows against equity without any debt. The use of debt will increase your overall return if the cost of debt (mortgage rate) is less than your discount rate (the cost of equity).
Here are some examples of discount rates for different classes of multi-family properties.
Multi Family Discount Rates
| Property Type | Discount Rate Range | Risk Profile |
|---|---|---|
| Core (Class A) | 5% - 8% | Low risk, premium location, strong tenant base, institutional investors. |
| Core-Plus (Class A/B) | 7% - 10% | Slightly older properties, stable cash flow, minor improvements needed. |
| Value-Add (Class B/C) | 9% - 12% | Moderate risk, needs renovations, potential rent increases. |
| Opportunistic (Class C/D, Distressed) | 12%+ | High risk, vacant or underperforming, major renovations required. |
Here are some more details about real estate classes.
Multi Family Asset Classes
| Class | Age | Location | Amenities | Tenant Base | Risk Level | Investor Type |
|---|---|---|---|---|---|---|
| A | 0-15 yrs | Prime | High-end | High-income professionals | Low | Institutions, REITs |
| B | 15-30 yrs | Good | Decent | Middle-income, stable renters | Medium | Value-add investors |
| C | 30-50 yrs | Working-class | Basic | Blue-collar, government-assisted | High | Cash flow investors |
| D | 50+ yrs | Distressed | Minimal | Low-income, high turnover | Very High | Speculative investors |
Conclusion
The discount rate is an essential tool to determine whether a multifamily property is a good financial decision. It helps measure risk versus reward and compare potential returns to safer investments like bonds or alternative opportunities. A well-informed approach ensures you are not overpaying for a property and that it aligns with your financial goals. By understanding how discount rates affect valuation and returns, investors can avoid costly mistakes, maximize cash flow, and build a strong foundation for future real estate success.
Thoughts on Input Field Estimation
A common theme in the mis-valuation of property is skipping certain expenses for one reason or another. It's imperative that you make a good faith estimate for each expense, even if today you think that expense can be mitigated or entirely removed because of your particular situation. The future value of a property should be based on what an astute investor will pay, not an outlier owner occupier or someone who loves to do the maintenance themselves.
Annual Gross Rent
The main driver of profitability is how much rent you charge for your property. You must remember that the market is the determiner of rents. Charging higher than market and hoping for the best, is a recipe for disaster. You need to make a fair estimate of rent based on your property's location, condition, type, amenities, etc. For example if you buy a duplex built in the 1920's that is 1,200 per side with 2 beds, 1 bath a piece, with radiator heating, you can't compare that to a brand new luxury apartment building with modern amenities, a gym, etc. Look for similar properties in your area and what they are renting at. It might even be worth visiting those properties to get a more concrete idea of your competition. For the annual rent increase it's best to be conservative. It's important to understand your market, understand that rent growth rates usually don't outstrip wage increases or inflation forever, and that buildings age and that aging has an effect on rent growth.
Maintenance
It's important to make an accurate assessment of periodic maintenance expenses. Things like lawn care, snow removal, annual backyard clean up, gutter cleaning, etc. should be taken into consideration. Even if you are to do the maintenance yourself, which is often the case for owner occupied multi-family housing, you should estimate maintenance expense for two reasons: (1) you may move out one day and will want to know how that will affect your profitability and (2) other investors will factor in maintenance and this will change the expected terminal value or sales price and possibly your overall return.
Property Taxes
Property taxes vary from jurisdiction to jurisdiction and in many cases can make up one of the largest expenses against income. It's important to understand the local property taxes of an investment and how they are calculated. In many jurisdictions the market value and legal assessed value are not the same. You can usually look up the current assessed value of the property and taxes owed for the county the property resides in.
Here's a real-world example from Cleveland, Ohio, which is located in Cuyahoga County. The information here is straight off the county website.
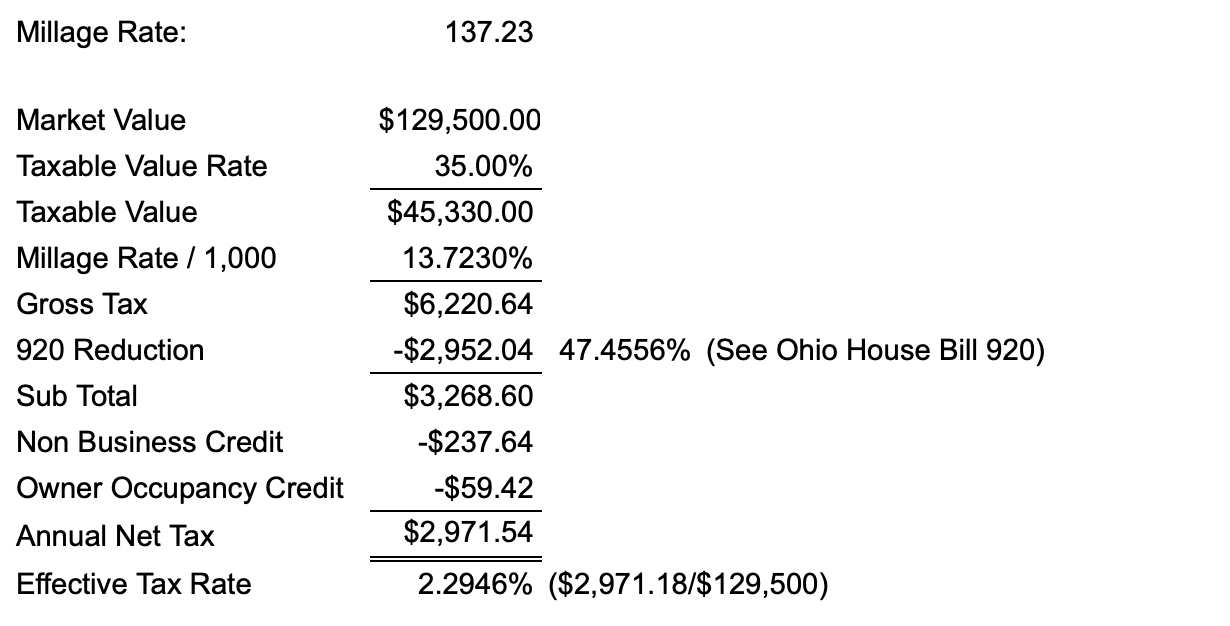
As you can see, there is a bit more involved than simply applying a rate to a value when calculating property taxes. In our example one significant factor is the 920 Reduction which protects against inflation related price increases. This rate is recalculated each year. Reading Ohio House Bill 920 will give you more insight into how this will affect your future calculation.
In many jurisdictions there are ad valorem (a rate applied against the value of the property) and non-ad valorem (a tax not based on the value of the property) taxes. Most property taxes are to fund school expenditures but there also may be bond payments, sewer, water, insect control fees, special district assessments etc. It's a good idea to become familiar with how property taxes are constructed in the area you are investing in so you can make an accurate estimation.
Shortcut Rate
If you were investing within the city of Cleveland, for example, you could calculate a short cut rate to apply in your analysis across any property in that area as follows:
Tax Rate = 137.23 / 1,000 x 0.35 x (1 - 0.474556)
Tax Rate = 0.025237 = 2.5237%
Property Taxes = $129,500 * 2.5237% = $3,268
For many areas you can usually find these shortcut rates published per school district for the area you are investing in just by doing a search for the property tax for your property's locality.
If you believe the near future market value will be significantly higher than the current value you can apply this rate against it to determine a worst case property tax expense cash outlay in your analysis. On the flip side, if the assessed value is higher than what you would be willing to pay for the property, you can lower the property tax in hopes you can overturn the current assessed value in court or whatever process the taxing authority has for challenging property taxes.
Management
An often overlooked expense is the management expense. Many investors plan on doing the property management themselves and for many that's reasonable. Before you skip this expense ask yourself these questions: (1) If I have a portfolio of properties will I have time to manage them myself, (2) shouldn't I get paid for managing a property above the expected return? (3) If I decide to sell, will an astute investor looking to purchase this property not include management expenses in their value estimate? (4) What happens if I need to move out of the area? As you can see there are a lot of reasons to include the management expense in your cash flow projections and no good reason to skip it. Generally, the management fee charged by a professional property manager is the rent multiplied somewhere around 8-10%. Your mileage may vary in your area so you might want to investigate that.
Insurance
Easiest way to estimate insurance is to ask the seller's realtor what they currently pay. There are also simple formulas that can help to quickly get an estimate, for example: (as of 2025) using a per square foot dollar amount between $150 to $250 (midwest rates) with a 0.7% insurance premium rate and let's say 2,500 square feet works out like this: $150 x 2,500 x 0.7% = $2,625 annual premium. With experience you can dial in this formula for your area to get a quick estimate to see if a property is even worth looking into.
Utilities
In some cases the tenant pays all utilities and that's an easy estimate of zero. In many cases the tenant pays natural gas and electricity with the landlord paying water and sewer. In any case it's important to understand that utilities are variable rates. The more tenants you have per unit the higher the utility bill. Water and sewer bills estimated at the rate of the current occupancy of one tenant per unit will not bode well for your profitability when four tenants move into a unit.
Capital Reserves
Probably the most overlooked expense, capital reserves are the estimated amounts needed to be invested to maintain the property's functionality. Roofs, furnaces, appliances, exterior painting, etc. are expenses that are usually depreciable under the federal tax code. Not taking into consideration capital reserves will significantly put your property's income and value at risk. Having to pay $20,000 for a new roof that you didn't save for could significantly impact not only the profit on your investment but also your own personal finances. You have to take a hard look at future capital expenditures by getting the age of the current appliances, roof, etc. and making estimates of the cost of the replacement in the future. A simple way to do this is to estimate the total amount you'll need to invest in capital assets over your investment period and divide it by the number of years you expect to hold it. That way the cash flows are evened out and you can budget how much you need to save in order to pay for future capital assets.